A Decade of Million-Dollar Gifts Infographic: CCS and Indiana University Lilly School of Philanthropy
We live in a digital world. The internet provides a seemingly infinite amount of information at the click of a button. This wondrous convenience can also be overwhelming.
The instant gratification of the internet has shortened our attention spans. An interested donor who may not read your entire Annual Report might skim through and miss the most important details. They may stop reading altogether. Simplifying large quantities of data and knowledge into bite-sized chunks is key to engaging your audience. One useful tool to do so is the infographic.
An infographic (or information graphic) is a graphic visual representation of information, data, or knowledge intended to quickly and clearly present complex information.
Expresswriters.com lists why and how businesses should create infographics to increase profits. The non-profit sector benefits from these tips, as well. Creating and sharing infographics is a simple way to gain visibility for your nonprofit’s mission, projects, or fundraising efforts.
Create an infographic to recruit volunteers, display statistics about your organization, or information about the cause your non-profit supports. Spice up a text-heavy document with an accompanying infographic, like the Nonprofit Marketing Guide did with their 2014 Nonprofits Communications Trends Report.
For more details on the benefits of infographics and how/where to create them, read
2014 Success #5: Why & How You Should Create Infographics for Your Company.
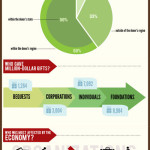
A Decade of Million-Dollar Gifts Infographic: CCS and Indiana University Lilly School of Philanthropy
Infographic: http://www.philanthropy.iupui.edu/research-by-category/a-decade-of-million-dollar-gifts