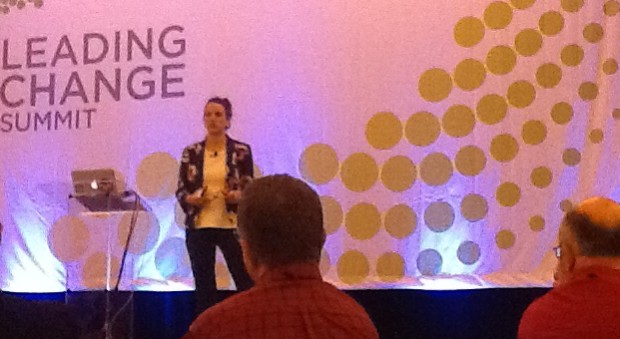
Day two of NTEN’s Leading Change Summit began with a love story- how Alexandra Samuel, VP of Social Media at Vision Critical (Twitter: @awsamuel) threw words to the wind and harnessed the power of data to tell compelling stories. And, very helpfully, she shared pointers with the ballroom full of nonprofit professionals on the best ways to do the same.
We are competing for voice with companies that have incredible amounts of data
Many fear numbers and data, but do have the capacity for compelling story-telling. But fear not: with a little advance-planning, the data can become invaluable tools for making stories more demonstrable of your organization’s impact and more relatable to donors. And, perhaps most importantly, this lover of data wants you to overcome the paralysis that many by imposing unrealistically high data standards- and to know that it shouldn’t keep you from telling your story.
It’s important to keep in mind that in order to get our organizations attention in the media “We are compteing for voice with companies that have incredible amounts of data.”
Her message is that nonprofits can be left behind if they are not harnessing data. And the good news is that data comes from people: your supporters and activists. So include them and you’ll be better able to tell stories and to anticipate their needs.
4 key components to consider before you begin:
Design- be clear on what story you want to tell in order to show the impact your organization is making. Great TIPS:
-Have a clear sense of what your’re trying to prove/disprove
-Sometimes the most important finding is the “non finding”. You may be disappointed, but may be a really useful point to share and a lack of difference can be a useful insight to making the story relatable to more.
Data- look within your organization for data you already have (hint: Look at all the places in your organization (ex: email open rates, info collecting in member sign up forms) Categories of data: Ask people, Observe people, Follow behavior
Team- include a critic to play Devil’s Advocate, include a data gatherer and organizer, and a great data visualizer
Dissemination- Here’s Samuel’s own plan for successful social media dissemination:
1. Take core report: put it on SlideShare
2. Produce long infographics (to pin and share)- it’s “The new executive summary” Don’t tell whole report, key findings only
3. Add to (or create!) a Pinboard on Pinterest. TIP: Pin each individually from whole report, this way you can get more leverage out of those to reprupose/ tweet out infographics
4. Outreach to conventional media for more “earned media” (PS: They love data-focused stories!)
Additional resources:
There are some free tools can help you like Google Correlate – see search patterns based on a data set and DataBib which has an index of free databases available.


Pingback: #14LCS – NTEN’s Leading Change Summit 2014 | Business for Culture & the Arts()