There are plenty of technological solutions for the nonprofit professional and organization. “Technology” can connect us all very quickly and easily in a variety of forms: smartphones, social media, and “the cloud.” But “leveraging technology effectively” is different. It requires a determination, at the onset, of what you will need and expect the technology to do.
Sure, effective storytelling is key to getting folks to connect with your mission in the first place. But how do you keep your mission moving forward and keep them connected?
Reporting on outcomes is key in keeping funders
An increasing number of funders and donors expect- if not require- reporting on outcomes. But how can an an organization generate a report that conveys impact?
Seems that most nonprofits are spending a lot of time trying to do just that. A lot of time.
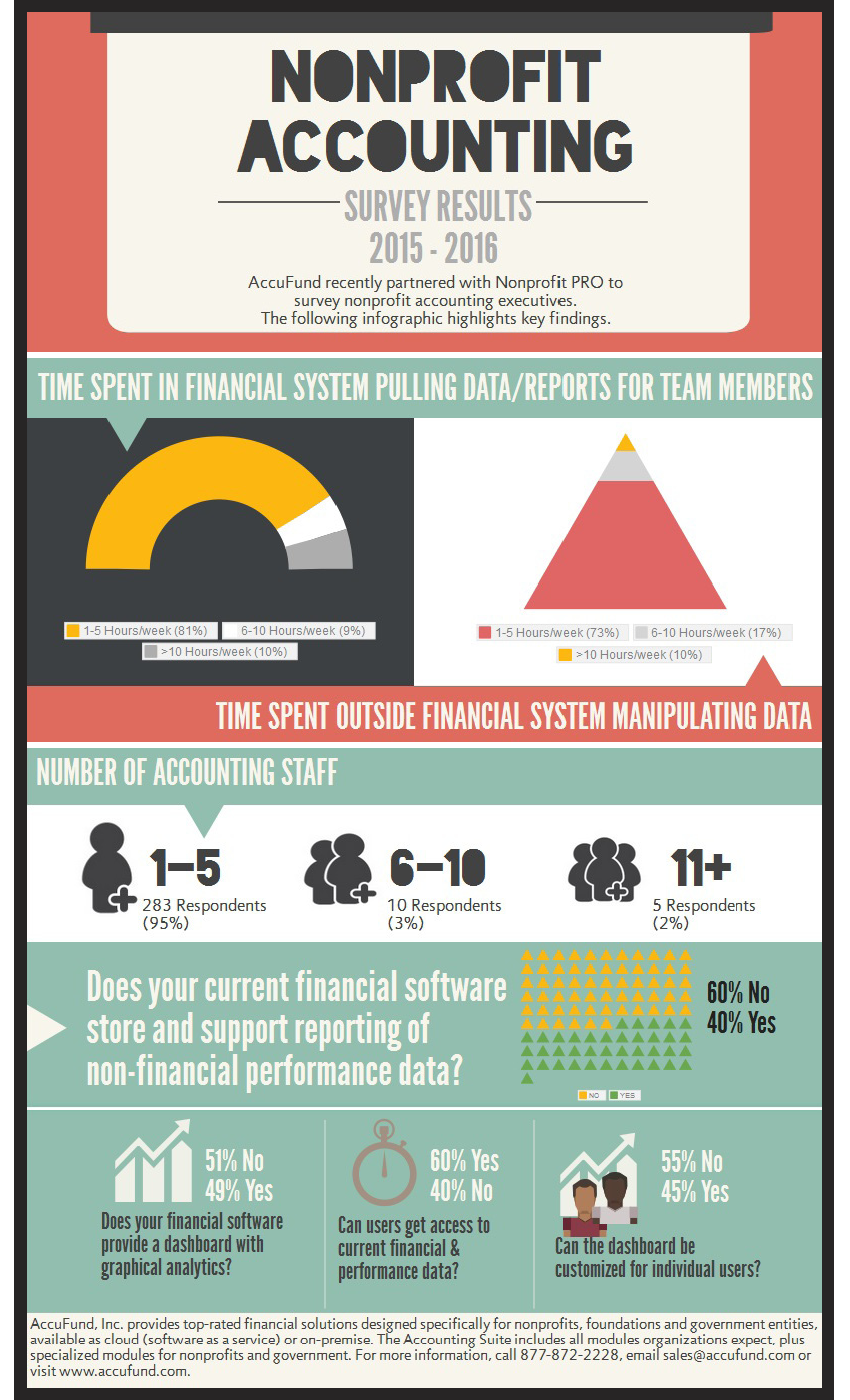
According to a new study commissioned by our friends at AccuFund, Inc., Needham, MA-based providers of top-rated nonprofit accounting and fundraising solutions, and conducted by NonprofitPro, many are finding that, “Capturing the right data that enables organizations to make important decisions is an ongoing challenge.”
Basically, the study finds that organizations have financial software that ties their hands when they attempt to create a visual representation of the impact of programs. The ability to be able to create such reports, would be beneficial.
Key Findings of Study:
- More than half of all respondents struggle with reporting non-financial performance data.
- Overall majority don’t enjoy the automation of reporting with 73% spending up to 5 hours a week manipulating data outside their financial system and 27% spend more than 6 hours per week.
- 95% report having under 5 accounting staff members; the reporting bottleneck can’t be solved by manual intervention.
- 81% spend up to 5 hours each week pulling data/reports within their financial system and 19% spend 6+ hours each week.
- 55% cannot customize their dashboard for individual users and 51% cannot view a dashboard with graphical analytics.
“It’s impossible for program managers to manage their programs with optimal efficiency when they are waiting on reports. It’s more than an inconvenience, it’s thwarting the mission,” says AccuFund President, Peter Stam.
The infographic below presents finding highlights. For more details on the Accounting Insights & Analysis Survey study findings go to www.accufund.com/npo-survey